Axiom’s dedicated MetricsDB provides a purpose-built metrics database that handles high-cardinality time-series data without the cost penalties and performance degradation common in traditional metrics systems. This section explains how to work with OpenTelemetry (OTel) metrics in Axiom.Documentation Index
Fetch the complete documentation index at: https://axiom-mano-metrics-builder.mintlify.app/llms.txt
Use this file to discover all available pages before exploring further.
Support for OTel metrics is currently in public preview. For more information, see Feature states.Axiom is confident in the quality of MetricsDB and the reliability of the data it stores. However, preview features are experimental, and Axiom doesn’t guarantee data integrity or accuracy for preview features.
What makes MetricsDB different
MetricsDB is engineered from the ground up to embrace dimensional complexity:- High-cardinality as a design principle: Store metrics with high-cardinality tags. Where other metrics databases penalize you with higher costs or degraded performance, MetricsDB treats high cardinality as a core capability.
- Intentional architecture: The storage format, query engine, and compression algorithms are specifically optimized for time-series metrics workloads. These design constraints are thoughtful trade-offs that deliver exceptional performance and cost-efficiency for real-world metrics use cases.
- Unified observability: Query metrics alongside logs and traces, enabling powerful correlations across all your telemetry data without switching tools or learning multiple query languages.
MetricsDB vs EventDB
Logs and metrics are different forms of event data. It’s often possible to represent metrics as events, but a dedicated metrics database comes with the following benefits:- Efficient compression: Instrumentation aggregates measurements on the client and sends summaries at regular intervals instead of individual events. This dramatically reduces data volume for high-frequency measurements.
- Standardized data types: OpenTelemetry defines a small set of metric types with clear semantics. The metric type tells you how to query the data—no guessing how to aggregate or calculate rates.
- Built for counters: Monotonic counters track cumulative values, enabling automatic service restart detection and accurate rate calculations even with sampled data collection.
When to use EventDB for metrics
Use EventDB when:- Your metrics are gauges: Point-in-time measurements like temperature or memory usage that don’t need rate calculations.
- Volume is low: You collect data from dozens to hundreds of series.
- Instrumentation is complex: Edge devices or legacy systems where adding OpenTelemetry support is difficult.
When to use MetricsDB
Use MetricsDB when:- You need counters: Track cumulative values like request counts or bytes sent with accurate rate calculations and restart detection.
- You use histograms: Analyze distributions for latency, response sizes, or other bucketed measurements.
- You have high volume or cardinality: Handle millions of time series, high-frequency collection, or thousands of unique dimensional combinations.
- You want simpler queries: Let metric types define how to query without deriving rates or handling restarts manually.
Prerequisites
- Create an Axiom account.
- Create a dataset in Axiom where you send your data.
- Create an API token in Axiom with permissions to ingest data to the dataset you have created.
You must use a dedicated dataset for OTel metrics. When you create a dataset, select the type of OTel data you want to send to it. For more information, see Create dataset.
Ingest metrics
You can ingest OTel metrics the same way you ingest logs and traces. For more information, see Send OpenTelemetry data to Axiom.The
/v1/metrics endpoint only supports the application/x-protobuf content type. JSON format isn’t supported for metrics ingestion.Query metrics
You can query metric data using the Axiom Console. For more information, see Query metrics.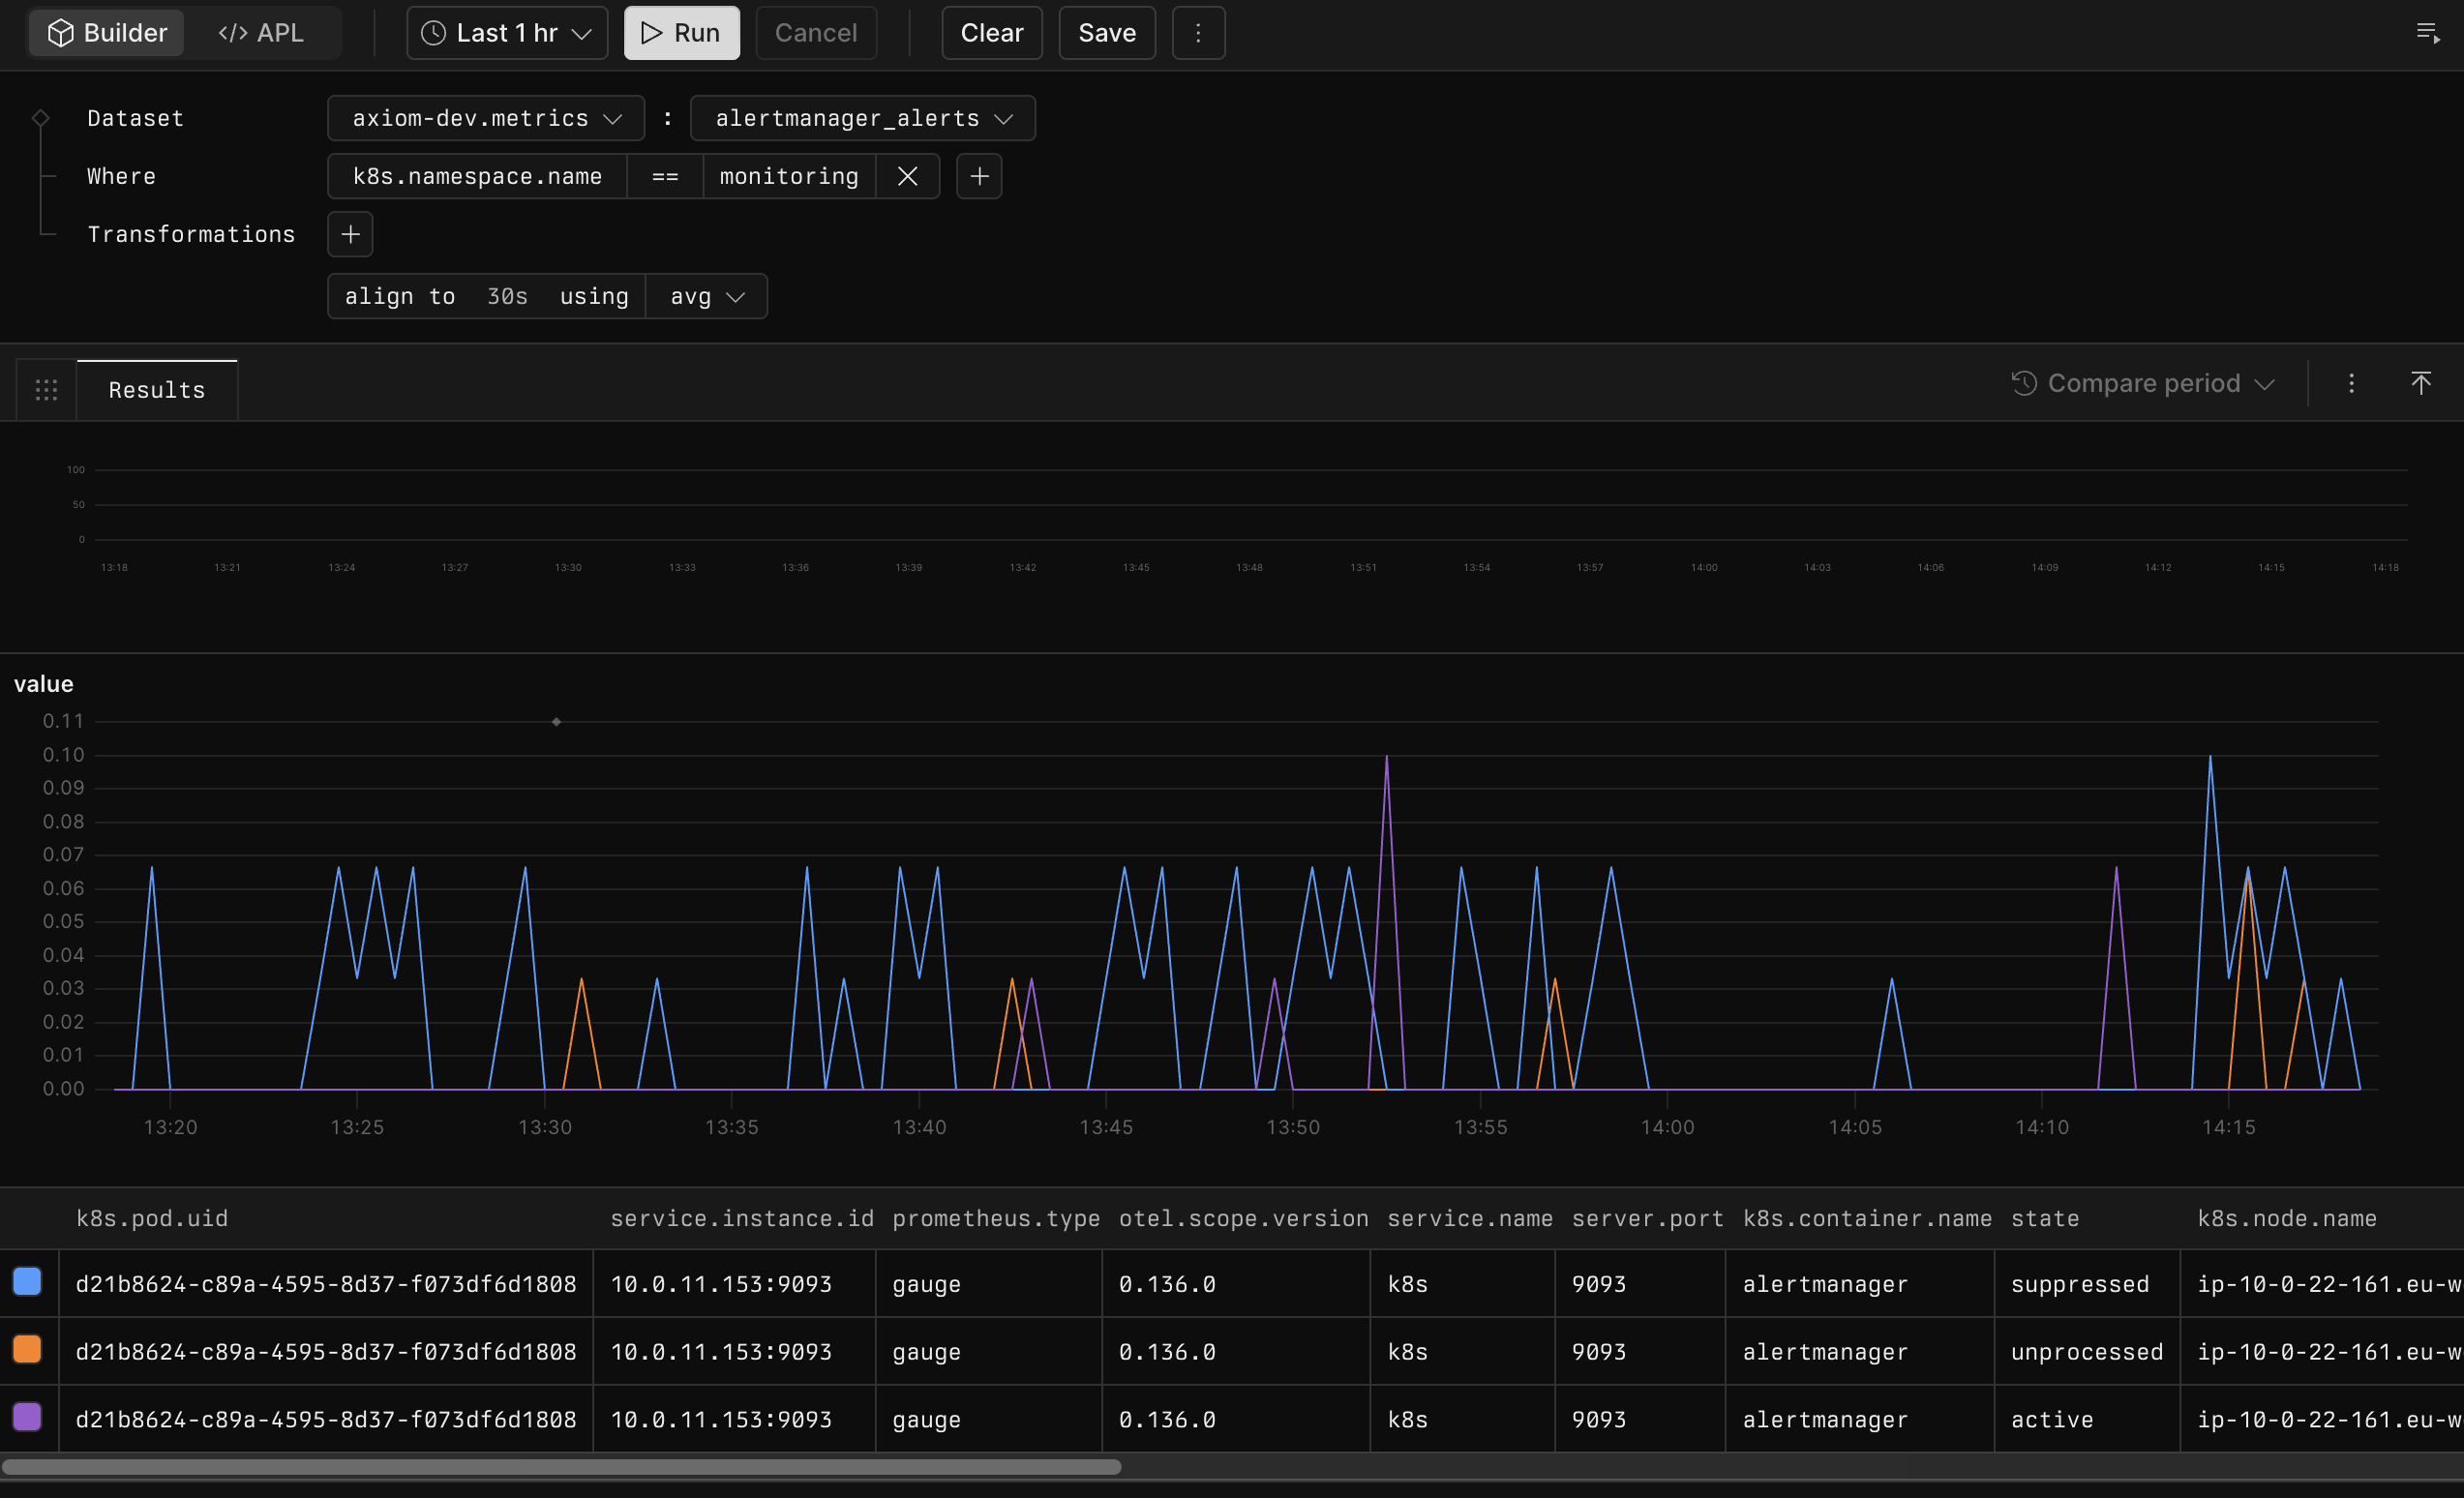
Dashboards and monitors
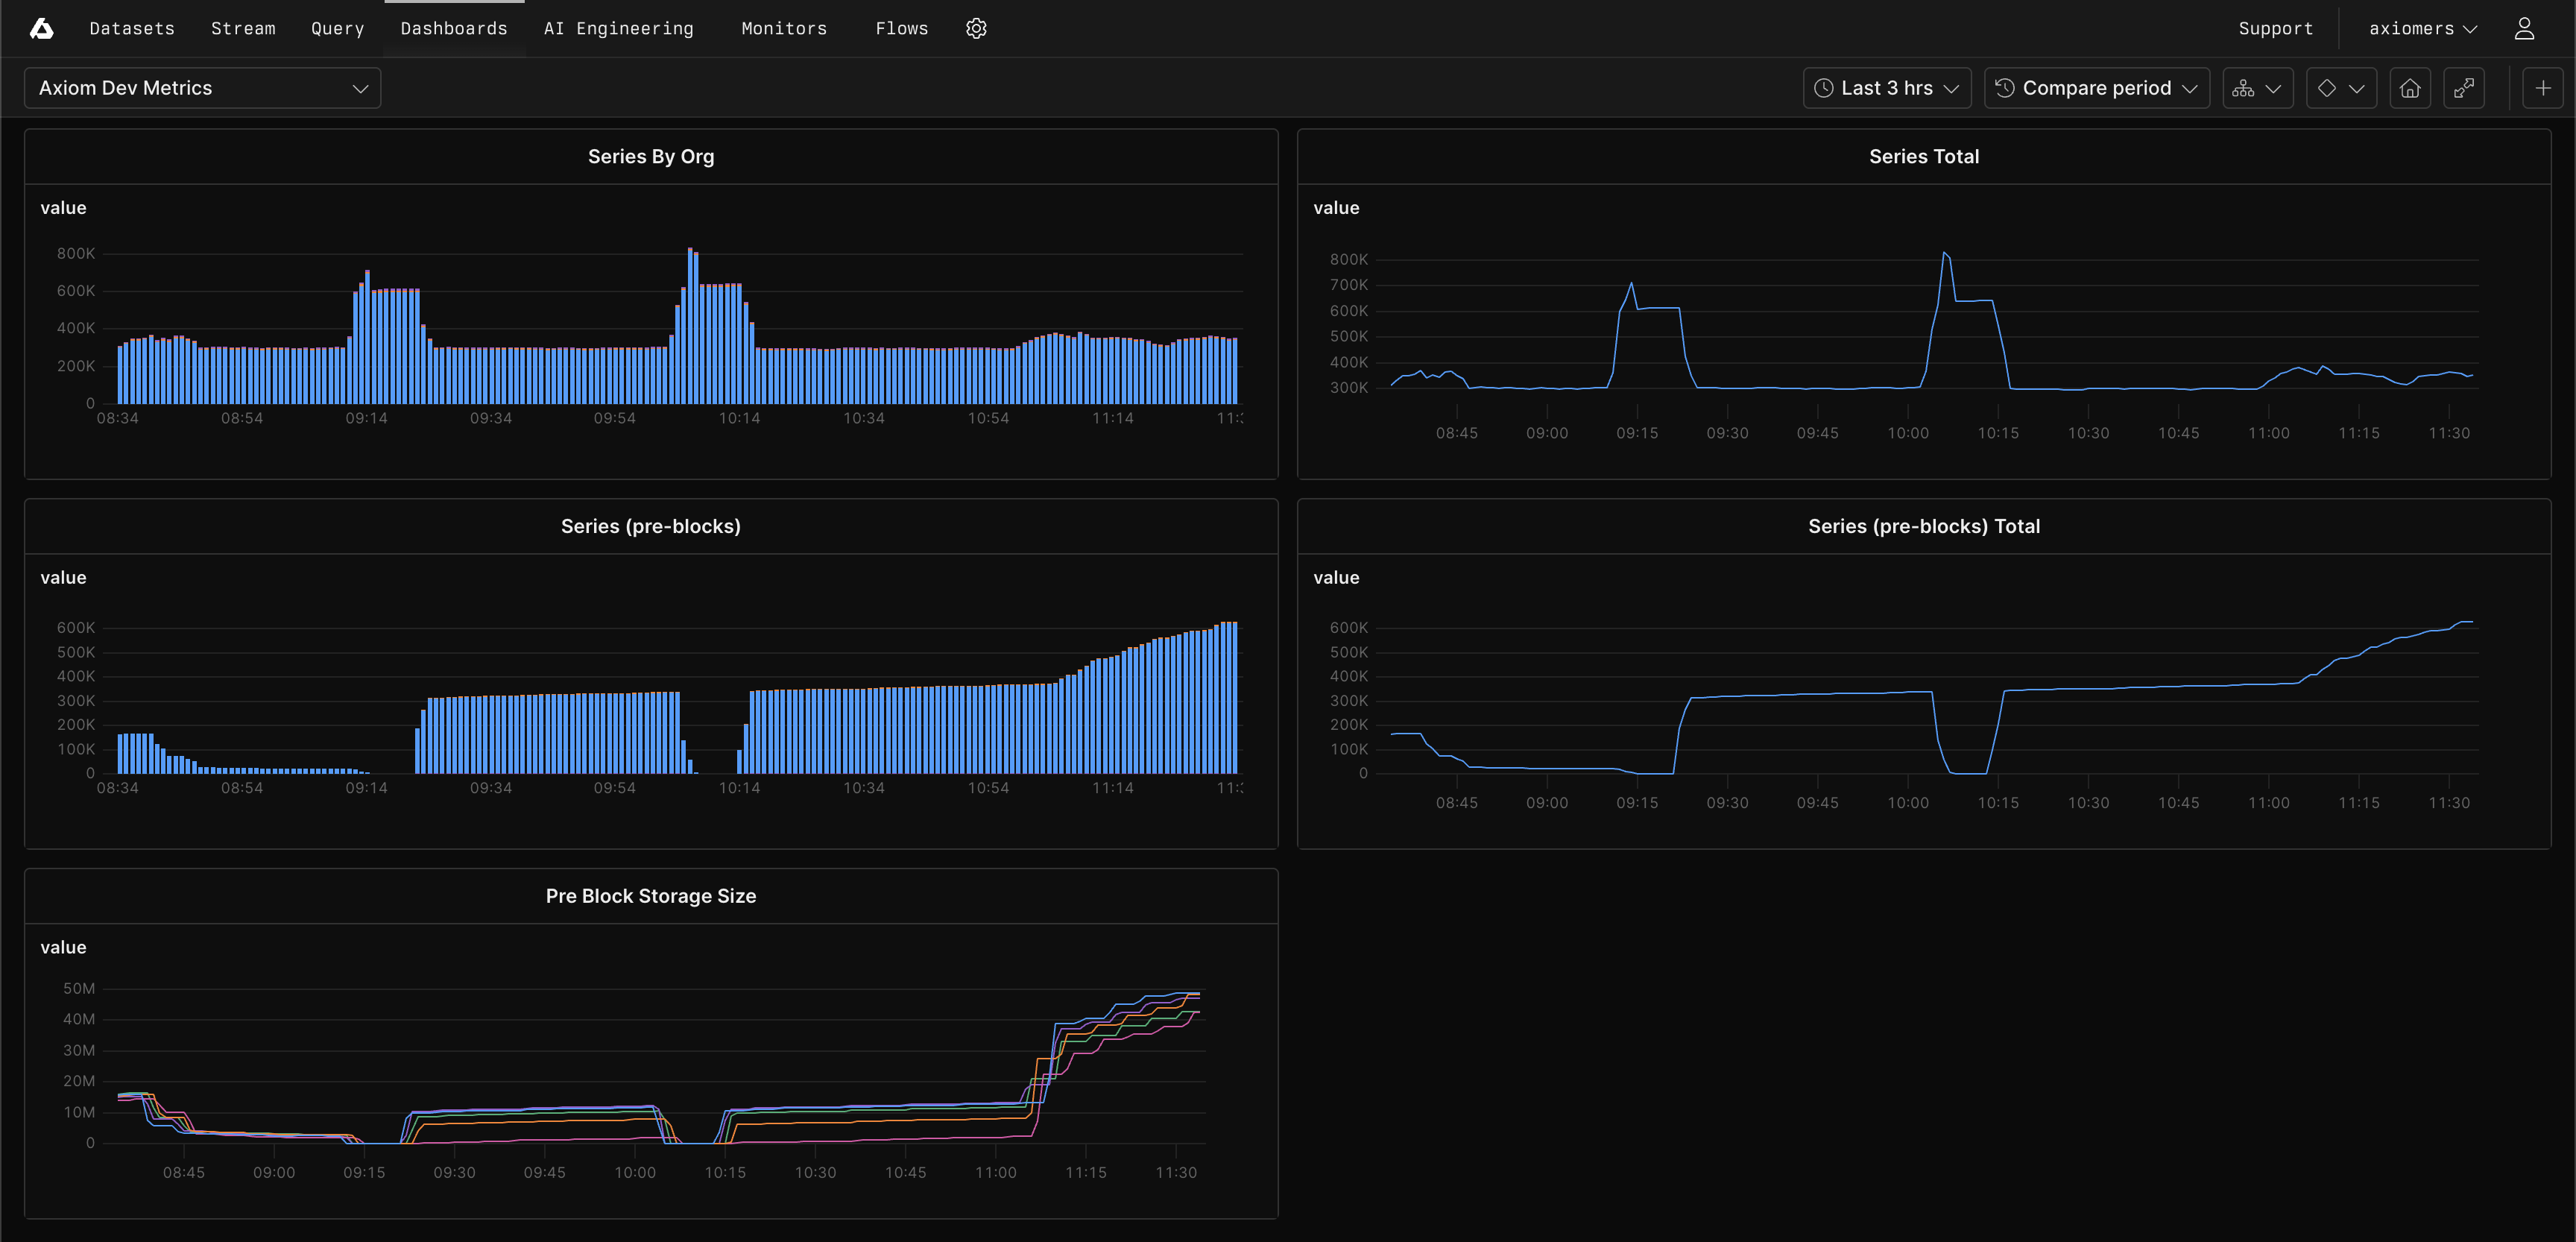
You can use OTel metrics in dashboards and monitors the same way you use logs and traces.- Build visualizations using metrics queries.
- Set alerts on derived metrics such as error rate or latency percentiles.
- Combine multiple signals in a single panel.
Design choices and constraints
MetricsDB makes intentional architectural trade-offs to optimize for the most common metrics use cases while maintaining exceptional performance at scale.Query scope
You can query one dataset per query.Supported data types
MetricsDB focuses on the core OpenTelemetry metric types that cover the vast majority of observability scenarios. Axiom supports the following OpenTelemetry metric types:- Gauge: Point-in-time measurements. For example, CPU usage or temperature.
- Histogram: Distribution of values with configurable buckets. For example, request latency.
- Sum: Sum of values. For example, request count.
- Summary: Summary of values. For example, request latency.
- Exponential histograms
bytes,kvlist, andarraytag value types- Exemplar, baggage, and context data
- Nanosecond-precision timestamps
Data model optimizations
MetricsDB applies the following transformations to improve query performance and reduce storage costs:- Timestamp precision: Truncate nanosecond timestamps to second precision. MetricsDB is built for use cases where second-level granularity is sufficient, and this optimization significantly improves compression ratios and query speed.
- Unified tag namespace: Flatten resource, scope, and metric tags into a single namespace. This simplification makes queries more straightforward and enables faster dimensional filtering. You don’t need to remember which tags came from which scope.
- Unit normalization: Convert the
unitattribute tootel.metric.unitfor consistent handling across all metric types. - Histogram handling: Assume equal-width histograms and don’t preserve histogram metadata. This trade-off supports the most common histogram analysis patterns (percentiles, distribution visualization) while reducing storage requirements.