Query and analyze your OpenTelemetry metrics data using the Axiom Console. This page shows you how to extract insights from your metrics through filtering, aggregation, and transformation operations. For more information on working with metrics at Axiom, see Metrics overview.Documentation Index
Fetch the complete documentation index at: https://axiom-mano-metrics-builder.mintlify.app/llms.txt
Use this file to discover all available pages before exploring further.
Support for OTel metrics is currently in public preview. For more information, see Feature states.
Concepts
- Dataset: A group of related metrics.
- Metric: A measurement that tracks a specific aspect of your system over time.
- Tag: A key-value pair identifying a series.
- Series: A unique combination of a metric and tag set.
Build metrics query
To build a typical metrics query:- Click the Query tab.
- Click Builder in the top left.
- In Dataset, define the source of your query. Select an OTel metrics dataset, and then select the metric you want to query.
- In Where, filter the results. Restrict the query to a set of series whose tag values match the conditions you specify.
- In Transformations, select the transformations you want to apply to the data.
- Click Run.
Example query
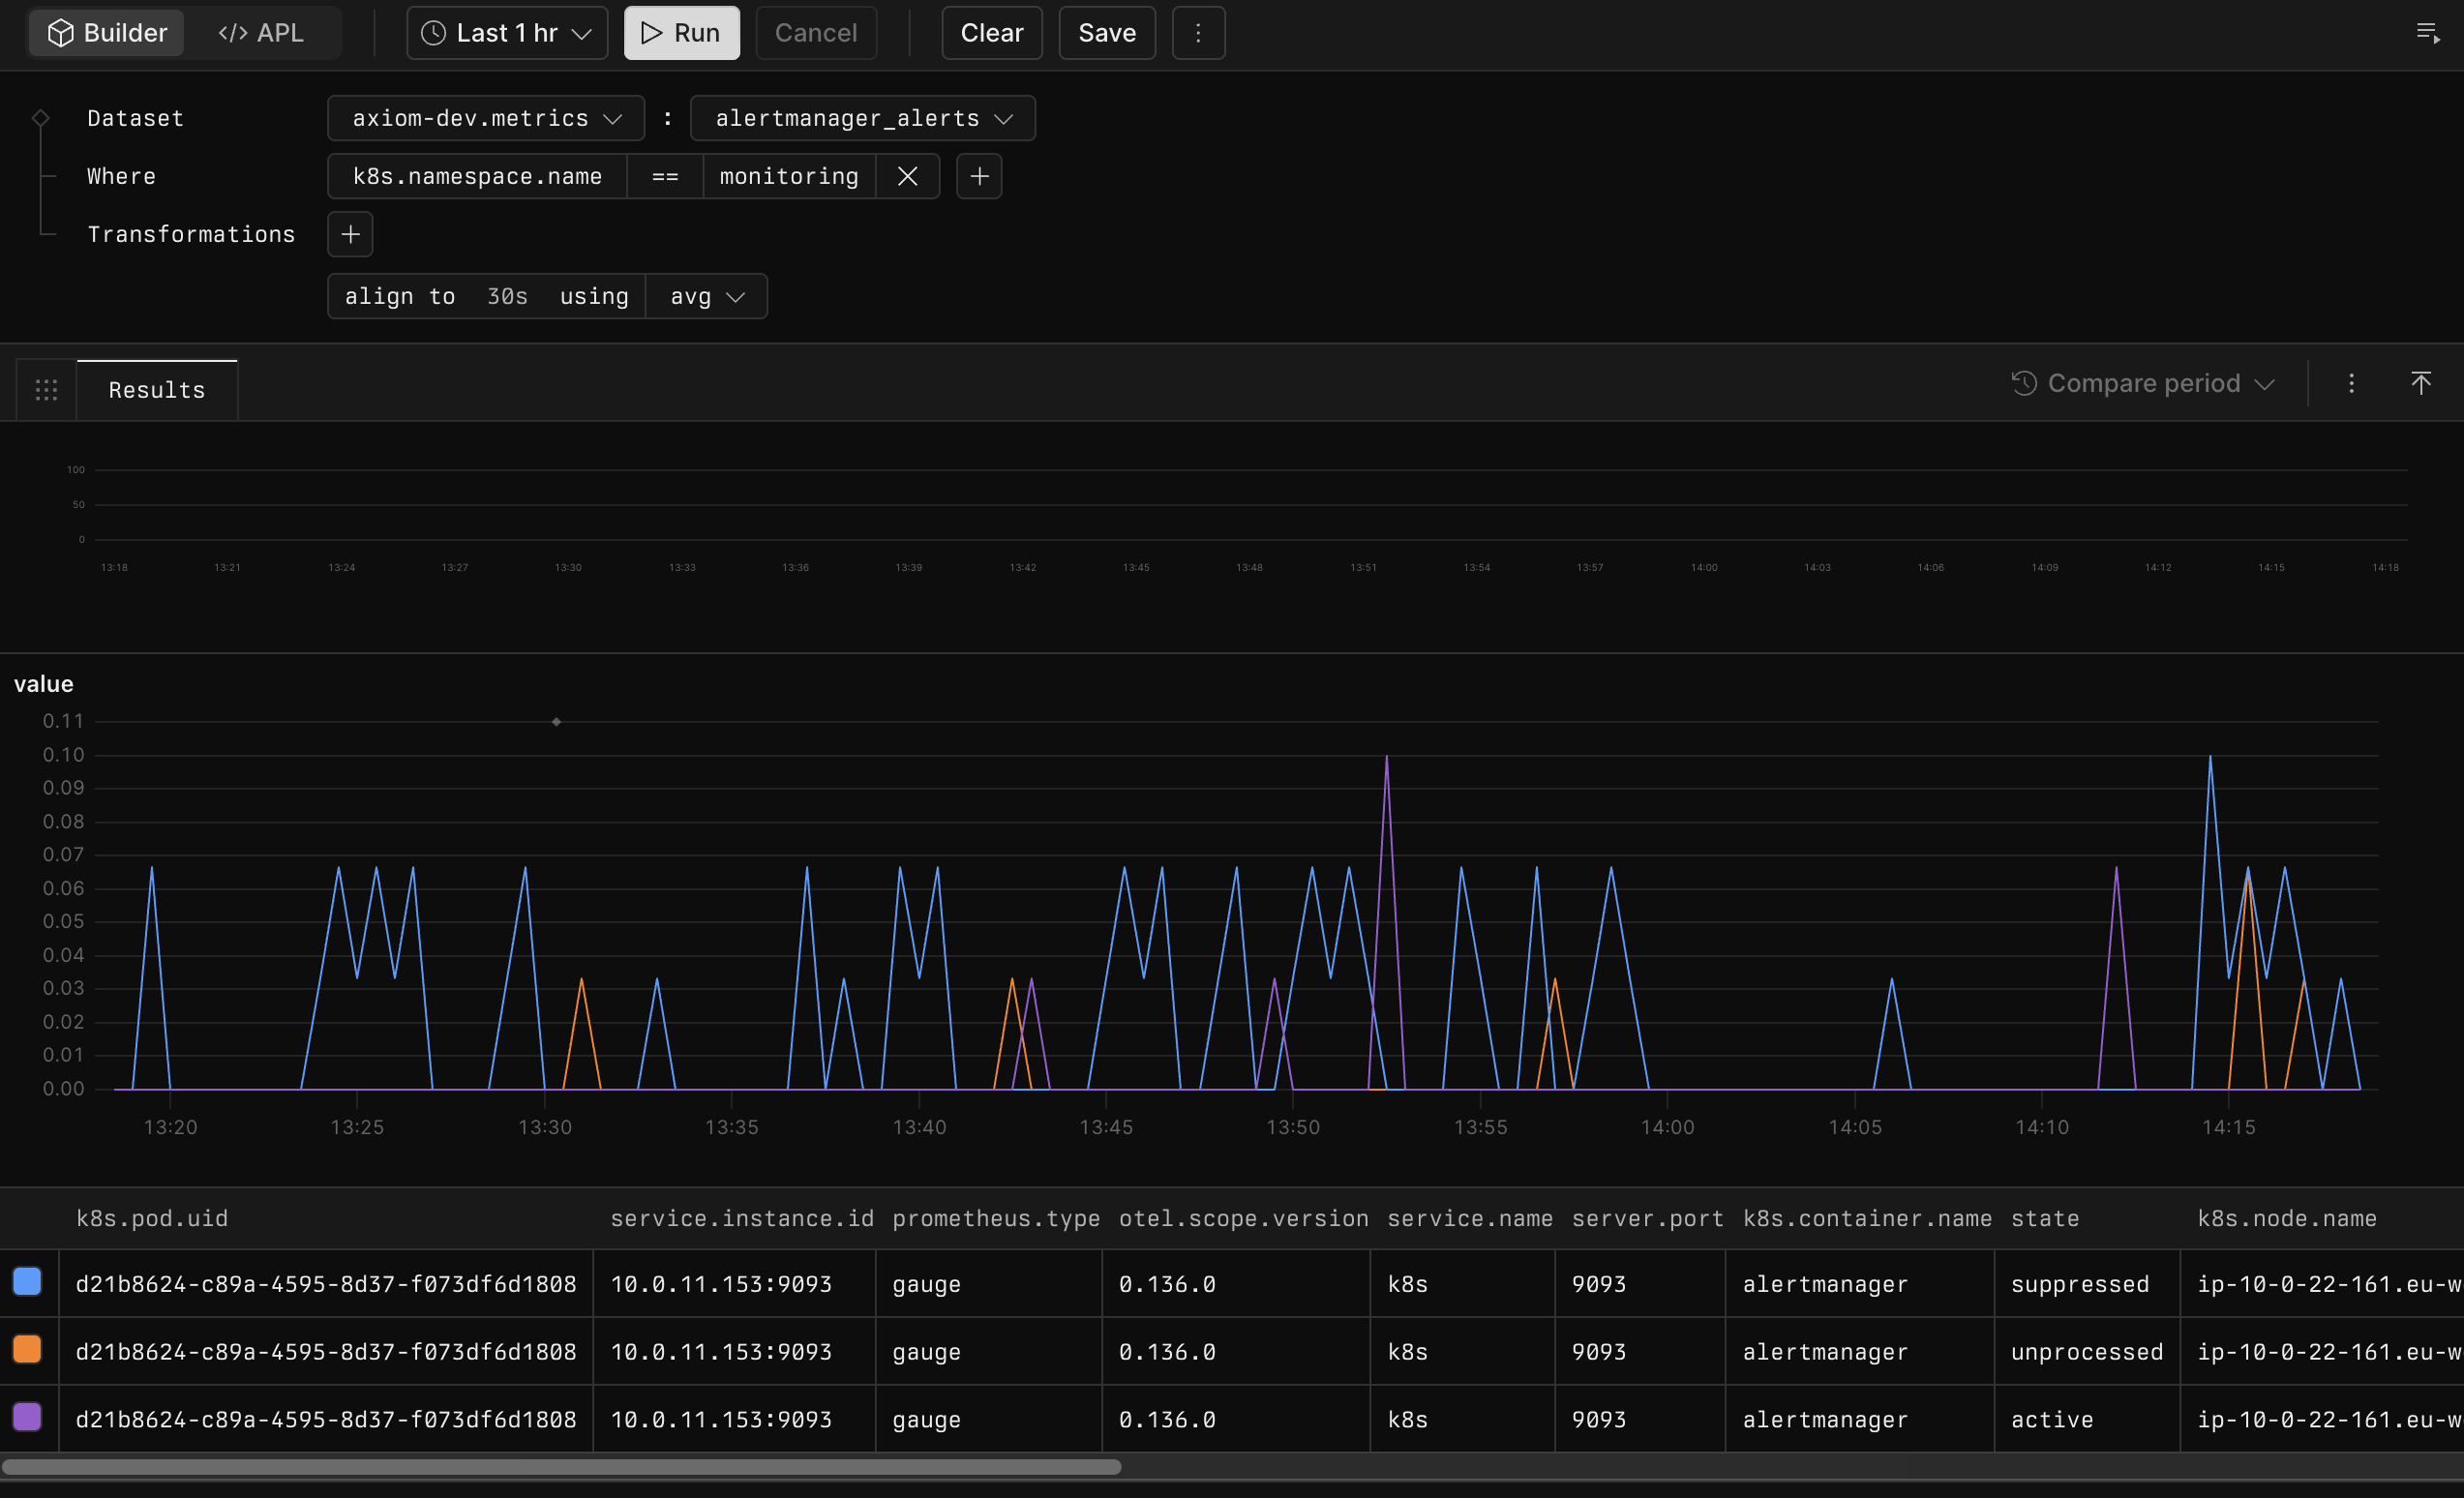
axiom-dev.metrics dataset’s alertmanager_alerts metric one hour before the current time. It filters results to events where k8s.namespace.name is monitoring and aggregates events over 30-second time windows into their average value.
Elements of queries
The following explains each element of a metrics query.Source
Specify the dataset and the metric in the Dataset field. The dataset and metric names are separated by a colon in the Builder interface. For example,axiom-dev.metrics:alertmanager_alerts.
Filter
Use the Where section to filter series based on tag values.- Click + in the Where section.
- Select the tag where you want to filter for values.
- Select the logical operator of the filter. Available operators are:
- Equality:
==,!= - Comparisons:
<,<=,>,>=
- Equality:
- Specify the value for which you want to filter.
- Click + to add another filter and join them with the logical and operator.
project == /.*metrics.*/ and code >= 200 and code < 300.
Transformations
Use the Transformations section to transform individual values or series.- Click + in the Transformations section.
- Select the transformation you want to apply to the data. Available transformations are:
- map: Map the data to a new value using the expression you specify.
- align: Aggregate data using the function and the time window you specify.
- group: Group the data by a set of tags using the aggregation function you specify.
Map
Usemap to transform individual values.
Available mapping functions:
| Function | Description |
|---|---|
rate | Computes the per-second rate of change for a metric. |
abs | Returns the absolute value of each data point. |
interpolate::linear | Linear interpolation of missing values. |
fill::prev | Fills missing values using the previous non-null value. |
map rate. To fill empty values with the latest value, use map fill::prev.
Align
Usealign to aggregate over time windows. You can specify the time window and the aggregation function to apply.
Available aggregation functions:
| Function | Description |
|---|---|
avg | Averages values in each interval. |
count | Counts non-null values per interval. |
max | Takes the maximum value per interval. |
min | Takes the minimum value per interval. |
prom::rate | Prometheus style rate |
sum | Sums values in each interval. |
align to 5m using avg. To count the data points in the last hour, use align to 1h using count.
Group
Usegroup to combine series by tags. You can specify the tags to group by and the aggregation function to apply. If you don’t specify tags, Axiom aggregates all series into one group.
Available aggregation functions:
| Function | Description |
|---|---|
avg | Averages values in each group. |
count | Counts non-null values per group. |
max | Takes the maximum value per group. |
min | Takes the minimum value per group. |
sum | Sums values in each group. |
- To calculate the number of series, use
group using count. To sum the values of all series, usegroup using sum. - To group data by the
projectandnamespacetags using thesumaggregation, usegroup by project, namespace using sum.